Los cuadrados mágicos que aún nadie ha podido resolver y se premian con 6.500 euros

- Details
- Category: Ingeniería mundial
- Hits: 859
 Llegados a este punto, resulta difícil imaginar que queda algún lector que no conoce qué es un cuadrado mágico. Como aún es más difícil encontrar alguien que no sepa lo que es un sudoku, diremos para los recién llegados que un cuadrado mágico es una especie de sudoku con algunas características distintivas:
-No hace falta que el número de casillas sea 9 x 9, vale cualquier cuadrado
-No deben repetirse los números en el tablero, tienen que estar los números naturales consecutivos empezando por el uno.
-Debe coincidir la suma de todos los números que estén en la misma fila, pero también la de los números que estén en la misma columna, incluso la de los números que estén en la misma diagonal. Este valor común recibe el nombre de constante mágica.
El ejemplo más antiguo, pues se conoce desde hace más de 4.000 años, corresponde al cuadrado mágico más pequeño que se puede construir –aparte del que solo tiene una fila y una columna- y recibe el nombre de Lo-Shu, debido a una leyenda clásica china. En la imagen de la izquierda se muestra dicho cuadrado ilustrado según la leyenda citada.
Se trata de un cuadrado de tamaño 3 x 3 y se comprueba fácilmente que están todos los números del 1 al 9 y que los números que forman cada fila, cada columna y cada diagonal suman 15:
4 + 9 + 2 = 15,
3 + 5 + 7 = 15,
8 + 1 + 6 = 15,
4 + 3 + 8 = 15,
9 + 5 + 1 = 15,
2 + 7 + 6 = 15,
4 + 5 + 6 = 15,
2 + 5 + 8 = 15.
Menos conocido, pero también perteneciente a la cultura china, es el mostrado en la siguiente imagen, que fue encontrado en las ruinas del palacio del príncipe de Anxi, con ocho siglos de antigüedad.
Es un cuadrado mágico de tamaño 6 x 6, pues contiene los números del 1 al 36 y la constante mágica es 111. No parece que haya sido muy fácil de encontrar, ¿cierto?
Desde hace mucho tiempo se conocen diversos métodos generales que permiten resolver cuadrados mágicos de cualquier tamaño. A falta de las limitaciones materiales sobre las dimensiones de una hoja de papel o del tiempo necesario para rellenar un cuadrado mágico de gran tamaño, se puede decir que, matemáticamente, el problema está resuelto.
Esto no detiene a los aficionados al ¡más difícil todavía! Si eliminamos algunas de las características que definen un cuadrado mágico, podemos plantear problemas más complicados, interesantes y atractivos. Como veremos enseguida, ya se han establecido premios a quien resuelva algunos de ellos.
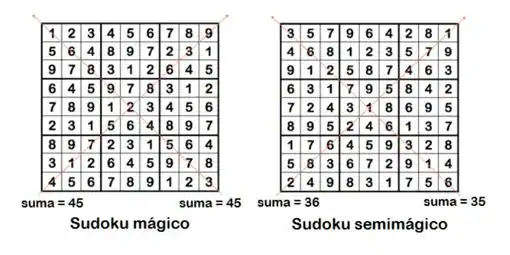
De aquí en adelante, seguiremos llamando cuadrado mágico a aquel donde la suma de los números de cada fila, de cada columna y de cada diagonal es la misma, aunque los números no sean consecutivos. A su vez, si solo la suma de los números de cada fila y columna es la misma (sin importar la suma de los números en las diagonales), tenemos el llamado cuadrado semi-mágico. Esto quiere decir, por ejemplo, que con esta definición todos los sudokus son cuadrados semi-mágicos pues en cada fila y columna aparecen todos los números del uno al nueve, así que la constante mágica es
1 + 2 + 3 + 4 + 5 + 6 + 7 + 8 + 9 = 45.
Aquellos sudokus en los que también sumen 45 los números que forman cada diagonal serán mágicos.
Ahora que permitimos otros números en la construcción de cuadrados mágicos, los métodos clásicos ya no son válidos pero la variedad de problemas que se pueden plantear aumenta considerablemente. Un ejemplo que ilustra el interés que ha despertado entre los matemáticos este tipo de desafíos es el cuadrado mágico que envió Leonhard Euler a Joseph-Louis Lagrange en 1770, el cual está formado solo por números cuadrados. La constante mágica es igual a 8.515:
El reto está servido: ¿serías capaz de encontrar un cuadrado mágico de tamaño 3 x 3 que esté formado por números cuadrados? En 1996, Martin Gardnerofreció una recompensa de 100$ a la primera persona que lo consiguiera. En abril de 2010, Christian Boyer amplió la oferta y publicó una lista de seis enigmas (incluyendo el anteriormente descrito). Ofreció una recompensa de 8.000€ y 12 botellas de champán a repartir entre quienes resuelvan dichos enigmas. En esta página se describen los problemas y el premio establecido para cada uno. Algunos ya han sido resueltos pero quedan todavía sin repartir ocho premios, que suman 6500€ y ocho botellas de champán.
Para animar al lector, describiremos algunos de ellos. El primero, con un premio de 1.000€ y una botella de champán, es una versión simplificada del planteado por Martin Gardner: ¿eres capaz de encontrar un cuadrado mágico de tamaño 3 x 3 que tenga al menos siete números cuadrados? No vale el único conocido hasta el momento:
 Andrew Bremmer y Lee Sallows descubrieron de forma independiente este cuadrado mágico de cuadrados, aunque necesitaron completarlo con los números 360721 y 222121, que no son cuadrados.
Para no ahondar en el tema, describiremos un segundo enigma de la lista de Boyer, también premiado con 1000€ y una botella de champán: ¿podrías construir un cuadrado semi-mágico de tamaño 3 x 3 que esté formado solo por cubos de números naturales? Lo mejor que se ha conseguido hasta el momento es un cuadrado semi-mágico con ocho cubos y es el siguiente:
 Estos y otros ejemplos son una muestra de que muchos problemas matemáticos pueden ser difíciles de resolver a pesar de tener un planteamiento elemental. Esto permite además aplicar el ingenio, la creatividad y la constancia en la búsqueda de soluciones, cualidades que no están reservadas a los matemáticos profesionales. Algunas especialidades matemáticas han surgido precisamente a partir de soluciones ingeniosas a problemas aparentemente elementales.
Jueves 27 de Julio del 2017 - http://www.ABC.ES
Sorpresa en Saturno mientras la Cassini se dirige a su Gran Final
- Details
- Category: Ingeniería mundial
- Hits: 797
A medida que la nave espacial Cassini de la NASA hace su serie de inmersiones semanales entre Saturno y sus anillos, un paseo sin precedentes que forma parte de lo que los científicos llaman la Gran Final, el equipo responsable de la sonda se ha llevado una nueva sorpresa. Resulta que el campo magnético del planeta no tiene una inclinación discernible, una observación sorprendente que se traduce en que, en realidad, todavía no conocemos la verdadera longitud del día en el planeta gigante.
Cassini, que orbita Saturno desde el año 2004, está ahora en la número 15 de las 22 órbitas semanales que pasan a través de la estrecha brecha entre ese mundo y sus anillos. La nave comenzó su etapa final el 26 de abril y continuará sus inmersiones hasta el 15 de septiembre, cuando terminará sus días lanzándose a la atmósfera del planeta.
«Cassini lo está haciendo maravillosamente en la última etapa de su largo viaje», dice Earl Maize, gerente del proyecto en el Laboratorio de Propulsión a Chorro (JPL) de la NASA en Pasadena, California. «Sus observaciones continúan sorprendiendo y deleitando mientras exprimimos cada último pedacito de ciencia que podemos conseguir».
Los científicos de la Cassini también están emocionados -y sorprendidos en algunos casos- con las observaciones realizadas por la nave espacial durante su última etapa. «Los datos que estamos viendo de la Gran Final de la Cassini son tan emocionantes como esperábamos, aunque todavía estamos inmersos en el proceso de elaborar lo que nos está diciendo sobre Saturno y sus anillos», dice Linda Spilker, investigadora en el JPL.
Según los datos recogidos por el magnetómetro de Cassini, el campo magnético de Saturno parece sorprendentemente bien alineado con el eje de rotación del planeta. La inclinación es mucho menor que 0,06 grados. Pero esta observación está en desacuerdo con la comprensión teórica de los científicos sobre cómo se generan los campos magnéticos. En teoría, los campos magnéticos planetarios requieren cierto grado de inclinación para sostener las corrientes que fluyen a través del metal líquido dentro de las profundidades de los planetas (en el caso de Saturno, se cree que es hidrógeno metálico líquido). Sin inclinación, las corrientes disminuirían y el campo desaparecería.
Cualquier inclinación del campo magnético haría que la oscilación diaria del interior profundo del planeta fuera observable, revelando así la verdadera longitud del día de Saturno, que hasta ahora ha sido difícil de alcanzar.
«La inclinación parece ser mucho más pequeña de lo que habíamos estimado previamente y bastante desafiante de explicar», dice Michele Dougherty, investigadora del magnetómetro Cassini en el Imperial College de Londres. «Hasta ahora no hemos podido resolver la duración del día en Saturno, pero todavía estamos trabajando en ello».
La falta de inclinación puede eventualmente rectificarse con datos adicionales. Dougherty y su equipo creen que algún aspecto de la atmósfera profunda del planeta podría enmascarar el verdadero campo magnético interno. Los investigadores continuarán recopilando y analizando datos durante el resto de la misión, incluso durante la última inmersión en Saturno.
Los datos del magnetómetro también serán evaluados de acuerdo con las mediciones de Cassini del campo de gravedad de Saturno recogidas durante la Gran Final. El análisis temprano de los datos muestra discrepancias comparadas con partes de los principales modelos del interior de Saturno, lo que sugiere que algo inesperado sobre la estructura del planeta está a la espera de ser descubierto.
Partículas de los anillos
Además de su investigación del interior del planeta, Cassini ha obtenido las primeras muestras de su atmósfera y anillos principales, que prometen nuevos conocimientos sobre su composición y estructura. La nave espacial ha recogido muchas partículas de los anillos de tamaño nanométrico mientras vuela a través de la brecha planetaria, al tiempo que su espectrometro de masas ha olfateado la atmósfera más externa llamada exosfera.
Durante las cinco órbitas finales de la nave espacial, así como en su caída final, el instrumento obtendrá muestras más profundas de la atmósfera. Cassini recorrerá la atmósfera exterior durante estos pasos, y se espera que envíe datos particularmente importantes sobre su composición durante la inmersión final. Además, las cámaras de imagen de Cassini han estado trabajando duro, devolviendo algunas de las imágenes de mayor resolución de los anillos y el planeta que se hayan obtenido jamás.
Jueves 27 de Julio del 2017 - http://www.ABC.ES
Digital Image Matching for Easy 3D Modelling
- Details
- Category: Ingeniería mundial
- Hits: 932
New Threat and Opportunity for Professional Surveyors
 Normally when something is too good to be true, it is not true. But in the case of digital image matching (DIM), professional surveyors should look twice – because their clients, and certainly those in the construction, infrastructure and 3D city mapping markets, certainly will. 'GIM International' asked John Taylor, who is responsible at Bentley Systems for reality modelling in Asia Pacific and in the global defence market, for his insights into DIM.
Digital image matching (DIM) did not arrive like a bolt from the blue. It has been around in the photogrammetric world for the past two decades but, through further improvements to filter approaches and also thanks to optimal adaption of algorithms for surface interpretation and object reconstruction, the technique has been refined to generate photo meshes out of 3D point clouds. Now, it is possible to produce 3D mesh models, point cloud data, digital surface models (DSMs) and true ortho images as data products by processing source data – primarily imagery and/or laser-scanned point clouds. The imagery can be obtained from aerial surveys, unmanned aerial vehicles (UAVs or ‘drones’), as well as ground-based mobile and static image capture using a variety of camera types, ranging from GoPro through to purpose-built air survey camera systems. Bentley is a prominent market player with its ContextCapture application which is being embraced by a growing number of companies, including Topcon recently. GIM International asked John Taylor, who is responsible at Bentley Systems for reality modelling in Asia Pacific and in the global defence market, for a peek inside the ‘black box’.
Pixel resolution
It is claimed that DIM makes it easy to produce 3D models using up to 300 gigapixels of photos taken with an ordinary camera, resulting in fine details, sharp edges and geometric accuracy. Getting straight to the point, Taylor is clearly very confident about the possibility of millimetre accuracy. “Accuracy will typically be twice the pixel resolution. The image sets consisting of aerial and terrestrial images need sufficient overlap, of course. Virtually any digital camera can be used. However cameras with larger sensors and high-quality lenses will provide more information, allowing for the potential of better results. It should be noted that data of differing resolutions can be processed into a single model, so model accuracies may vary depending on the geospatial extent of the source data used in the processing.”
The process of creating a 3D model or point clouds in ContextCapture starts with adding images and/or point clouds as the data sources. When photos are used, the images are automatically aerotriangulated through a process of image comparison. This process automatically extracts tie points, matches pairs and determines orientation and positioning of the block of images. “The aerotriangulation process can be computed entirely without control or camera positions, or else controlled using the camera’s positional metadata or surveyed control points,” explains John Taylor. The aero triangulated block can then be processed into a 3D model. This process determines the exact extent for the resultant data, and sets the desired coordinate system and data formats. The process cleans up the point cloud and produces a triangulated mesh with a high geometric precision. The mesh is then textured from the photos using the best resolution from various photos used in this process.
Additional detail
The biggest output difference between ‘traditional’ digital photogrammetry and digital image matching software is the result. In standard photogrammetry, the result is usually a 2D product or perhaps a DSM, and most vector data products are an abstract of the source content. DIM uses a combination of photogrammetry and computer vision to create realistic 3D models in mesh or point-cloud formats. However, for survey managers, the single biggest difference might be the efficiency of the production process. “The automated aerotriangulation and resultant production of data outputs has minimal resource requirements,” Taylor affirms. “While the overall processes are similar, the difference lies in the huge number of images that can be automatically processed, using relatively low-cost computing resources, in a fraction of the time taken using a specialised digital photogrammetric workstation. Additionally, various parts of a scene can be captured using different cameras and at different resolutions to enable the production of multi-resolution data outputs.” The benefit of this is that large areas can be captured at a lower resolution (e.g. 5-10cm), and then specific parts of the scene (buildings, utility infrastructure, etc.) can be captured at higher resolutions (e.g. 1mm-2cm) to provide a wealth of additional detail, which could not be managed easily using traditional digital photogrammetry. Multiple jobs can be loaded, set up and left to process outside of working hours as part of a prioritised job schedule, which is particularly useful when multiple (as-built) surveys are being captured daily. Hybrid processing with laser scan data is also possible. “Laser scanning data does have advantages in low-light or night-time capture conditions, but can be noisy depending on airborne dust particles or moving objects in the scene during capture. Imagery clearly requires suitable lighting conditions (natural or artificial), but is less noisy in terms of processing. Being able to process both sources into a single model is clearly advantageous. Adding point cloud data is useful on any project where a combination of point clouds and photos are available. Our software will use the highest-quality data in these cases, making use of the points where they are dense and accurate and the photos where point data may be absent. It can also process laser scanning data into surfaces without imagery present, so there is some flexibility in how these data sources can be employed.”
The surveying profession
When talking about ContextCapture, Bentley claims “You just need somebody with a camera”. On the other hand, the company names the surveying industry as a main target group. How can DIM be commercially attractive for the surveying professional rather than adding another nail to the discipline’s coffin? Taylor is convinced of the joint opportunities in surveying and engineering: “New value opportunities for surveyors are provided throughout the infrastructure lifecycle by ‘continuous surveying’. That also goes for surveying in those complex situations where laser scanning has a much longer acquisition time and delivers a less dense survey while image interpretation is crucial.” As an example, he takes the London Bridge Station project in the UK (see below and Figure 2). “Given the age of the structure at London Bridge Station and the logistical limitations of laser scanning – a process that would take too long to complete with one or two (more expensive) scanners – the engineers leveraged photogrammetry for the initial survey and regular updates. It was less disruptive to the on-site workers, given the speed and size of a small digital camera to survey the site. Those are new kinds of services to deliver by surveying companies. They themselves or the client can use DIM to process the images into accurate 3D mesh models to facilitate decision-making or provide as-built documentation.”
With regard to complex conditions, he also refers to a smart city project in the city of Coatesville, USA. An engineering group was tasked to provide 3D design and conceptual planning services as part of the city’s ‘The Flats’ brownfield redevelopment, a rugged 30-acre former steel-mill site which contained hazardous materials. These conditions made it expensive (USD40,000) and potentially dangerous to perform a traditional on-site survey so the engineers decided to use aerial photos and DIM. They took 750 aerial photos in 20 minutes. It took 8 hours to produce a 3D engineering-ready model and three days for a final engineered plan, thus achieving a significant saving for the city.
Data formats
ContextCapture supports different software workflows within a single organisation, including a variety of CAD and GIS platforms. For those that fully embrace 3D, then the basic 3D mesh formats of OBJ, OSGB and Collada will often be supported by those systems as the formats have been around for some years. That is also the case for Esri, which has also chosen to develop its own 3D scene format, i3s; Bentley offers it as a standard export format. Specific CAD solutions are also supported by formats such as Bentley’s 3MX, 3SM and DGN and Autodesk’s FBX formats. Additionally, as 3D GIS increasingly looks towards the web as the core delivery platform, Bentley has partnered with AGI to form the Cesium Consortium and to enable Cesium 3D tile export as standard. If the GIS still requires 2.5D data for analysis, ContextCapture provides editing capabilities that automate DEM extraction and then export the resultant DEM data to suit GIS import, either in text or Grid formats at user-selected data densities. Ortho images are another standard output that support GIS data needs, and for those systems that are point cloud capable then 3D data can be exported as an LAS point cloud file.
London Bridge Station
Plans for the London Bridge Station included reconstructing its concourse to include 15 new platforms, as well as establishing new retail stores and facilities. The Costain Group, which led the engineering project, needed an accurate 3D representation of the aging masonry structures to understand the subsurface for reconstruction potential. The model would also enable stakeholders to make better decisions on a tight schedule. While Costain previously used laser scanners to capture digital data to survey and document site conditions with precise accuracy, they now experimented with DIM. Using a simple camera to capture the old surface area delivered a denser survey than a scanner would, and also provided colour, enabling designers to quickly identify the bricks from the mortar joints. The project team then used ContextCapture to process the images into accurate 3D mesh models that facilitated decision-making and provided documentation of existing conditions that could be used throughout the lifecycle of the infrastructure. The use of DIM technology reduced the time it took to collect data and eliminated the process bottleneck associated with sharing a scanner among two dozen surveyors. Moreover, it streamlined workflows and improved design efficiency.
http://ABC.esLunes 10 de Julio del 2017
The Increasing Importance of Satellite-derived Bathymetry
- Details
- Category: Ingeniería mundial
- Hits: 1450
Effective Surveying Tool For The Shallow Water Zone
 Bathymetric data in the shallow water zone is of increasing importance to support various applications such as safety of navigation, reconnaissance surveys, coastal zone management or hydrodynamic modelling. A gap was identified between data demand, costs and the ability to map with ship and airborne sensors. This has led to the rise of a new tool to map shallow-water bathymetry using multispectral satellite image data, widely known as Satellite Derived Bathymetry (SDB). Read on for an article providing an overview of the SDB methods, showing how data can be integrated into survey campaigns and highlighting three use cases.
(By Knut Hartmann, Magnus Wettle, Thomas Heege, EOMAP, Germany)
Strictly speaking the methods to derive information on seafloor topography using reflected sunlight date back to the 1970’s but it has required iterative improvements of algorithms, computational power, satellite sensors and processing workflows in order to provide the current state of the art. Today, a range of different methods exist under the umbrella of the SDB term. However, as with traditional survey methods it is imperative to understand the advantages, disadvantages and overall feasibility in order to evaluate the suitability and fit-for-purpose of a given SDB application.
Bathymetric Data Production
Historically, empirical methods were used, which require known depth information over the study area. By comparing these known depths with the satellite signal, a statistical relationship can be derived that adequately describes depth as a function of the signal. Aside from requiring known depth data, these methods will only work for a given satellite image. A subsequent satellite scene, even of the same location, may contain different atmospheric and in-water parameters, and thus the statistical relationship needs to be re-calculated. Another aspect of these methods is that the statistical relationship is only valid for one water type and one seafloor type. Therefore, when an area contains different types such as coral, sediment, algae and rubble, the statistical relationship needs to be calculated for each of these substrate types. The correct formula then needs to be applied to each pixel in the image, i.e. the algorithm needs to be informed a-priori which substrate type it is encountering in that image pixel. This brings the problem full circle back to one of the fundamental challenges of satellite-derived bathymetry: how do you know that a darker signal is due to deeper water, a darker substratum, or a bit of both? These methods can still be useful as they are relatively straightforward to implement (see The IHO-IOC GEBCO Cook Book, 2016).
Physics-based methods on the other hand, do not require known depth information for the study area, and can therefore be applied independent of satellite data type and study area. These methods rely on fully describing the physical relationship between the measured light signal and the water column depth. Optical variability in the atmosphere and water column is accounted for within the algorithm inversion, and no 'tuning' to known depths is required. Therefore, an area can be targeted which is physically inaccessible and for which there is no previous information known. Not surprisingly, these physics-based methods require more sophisticated algorithms and powerful processing capacity. The benefit is that they typically prove to be more accurate, especially in areas with varying substrate types, turbidity and/or atmospheric conditions. This is of particular importance because only a small fraction of the sunlight recorded by the satellite’s sensor originates from the source which can be associated with water depth. Depending on the wavelength channel, this fraction varies typically between less than one and up to a maximum of 20%, going from near-infrared to green/blue light energy. It is critical to accurately account for the other sources of light energy in order to separate out the relevant water column depth contribution to the measured signal.
Data Integration
The integration of SDB data into daily use can be straightforward if the bathymetric data quality and delivery formats follow best practice. Hence the file formats typically follow industry standards (OGC) and enable a direct use in current GIS or online visualization tools through Web Mapping of Coverage (WMS, WCS) interfaces, hydrographic software or scripting tools. ISO conform metadata including important information on tidal corrections, processing levels and date and time of satellite recording are essential for geodata and are mandatory for all SDB data.
Furthermore, it is important to understand the uncertainties in the data as well as the limitations of SDB for a given application in order to integrate the data appropriately. Such information needs to be expressed in uncertainty layers which should ideally include quantitative information. For some applications, such as safety of navigation, additional information such as the ability to identify obstructions of different sizes needs to be included as well.
Safety of Navigation
Satellite Derived Bathymetric information supports safety of navigation by providing up-to-date and high resolution grids of the shallow water zone. This is of particular importance in areas with outdated charts or dynamic seafloor. In addition to the bathymetric information, of particular importance is the identification of obstructions which could be a risk to navigation.
Ideally the bathymetric data are provided in the form of digital nautical charts (ENCs) and ECDIS (Electronic Chart and Display System) as the main navigation device which represents the standard for the majority of vessels. Satellite Derived Bathymetry data cannot immediately be used for navigation with ECDIS – however, it can serve as an additional data source when updating the bathymetric information of nautical charts (paper or digital). ENC Bathymetry Plotter, a recently finished software product of SevenCs’ chart production suite, represents a powerful tool to create depth-related information objects for inclusion in ENCs which fulfill all relevant IHO quality standards. SevenCs and EOMAP have teamed together to provide an innovative service, the combination of up-to-date shallow water bathymetry provided as a standard ENC. This can therefore be used immediately on board vessels. An update of official ENCs which include Satellite Derived Bathymetric data, is therefore possible at the commencement of a voyage, but also during the vessel’s journey - via satellite communication - and therefore allows for the planning of more efficient shipping routes, increased safety as well as an improved situational awareness to react to a forced change of the shipping route (e.g. weather events or other threats).
It is obvious that the need for updating ENCs for safety of navigation is of importance for poorly mapped areas. It should not be understood to replace recent and high resolution and quality ENCs if available.
In 2016 bathymetric data was provided to Van Oord covering several atolls in The Maldives. The data were used to enhance safe navigation by charting all shoals which might or might not be indicated on Electronic Navigation Charts. This contributed to efficient planning of the project’s activities. Data were provided within few days after ordering covering an area of several hundred sq km, which showcases the flexibility of the technique.
Reconnaissance Survey
Satellite Derived Bathymetry can play a role as a reconnaissance survey tool in applications ranging from shallow water seismic surveys, coastal engineering to optimal planning of acoustic surveys. Although different in usage, all of these applications have in common that they require bathymetric data which is (a) spatial, (b) high resolution, (c) rapidly available and (d) affordable within a typical planning phase budget. Reconnaissance surveys are usually relevant for areas which are poorly surveyed, where charts are outdated or where bathymetric data are simply not accessible. Many examples for these kinds of applications have already been published and two showcases are summarised in the following paragraphs.
In 2013, EOMAP mapped the shallow water bathymetry of the entire Great Barrier Reef, Australia, at 30m grid resolution. This was the first depth map of its kind for the entire Great Barrier Reef, and also the largest optical SDB dataset ever made. In 2014 Shell published a paper on the use of EOMAP’s Satellite Derived Bathymetry (delivered at 2m grid resolution) to support their shallow water seismic campaign in northwest Qatar (Siermann et al. 2014). SHELL summarised the benefits of using the satellite techniques over more traditional methods by citing a 1 Million USD costs savings and very timely delivery of the data.
Basis Data for Hydrodynamic Modelling
Hydrodynamic modelling exercises, such as generating tsunami forecast models, are typically not the type of applications with budgets that allow for purchasing bathymetric survey campaigns using more traditional methods. Commonly, very coarse resolution bathymetric grids such as GEBCO are used instead, but this has limited validity in coastal areas. By using Satellite Derived Bathymetry, shallow water depth data can be derived at fit-for-purpose grid resolution to within a limited budget. As a standalone dataset it does not fulfil the modellers requirements but when merged with up-to-date information on the coastline –(also derived from the satellite imagery), survey and chart information, a seamless shoreline-to-deep-water dataset can be created, which greatly improves on currently available datasets. Such a dataset was created for the Gulf region, which now serves as bathymetric dataset for tsunami modelling in the area.
Future perspectives
Over the intermediate term it is expected that satellite-derived mapping of the seafloor will continue to be increasingly accepted and integrated as a survey tool - as is now already the case for a number of innovative user groups. Developments are still needed in areas such as how to best quantify uncertainties and small scale obstructions. One likely development will be the mutlitemporal and sensor agnostic mapping approach, which can be oversimplified as: use all available image data to the best possible extent and quality. With the advances of cloud computing, physics-based algorithms and an increasing selection of image data, this is would be a natural evolution for Satellite Derived Bathymetry.
More Information
About the authors
Dr Knut Hartmann, director Client Services for EOMAP. During his educational and professional background in environmental science and remote sensing he was involved in projects for O&G and engineering, HO’s and environmental agencies.
Email: hartmann@eomap.de
Dr Thomas Heege, CEO, founded EOMAP in 2006 as spin-off from the German Aerospace Center DLR. He has more than 20 years of research, development and industry experience in satellite-derived products and methods.
Dr Magnus Wettle, managing director for EOMAP Australia Pty Ltd. With more than 15 years experience in aquatic remote sensing, he has previously held positions at the University of Queensland, Geoscience Australia and CSIRO.
llustrations
Figure 1, The diagram shows the relative amount of measured light energy which contains water depth information.
Figure 2, Current ENC (March 2016 ,left) and overlaid by SDB data (right) showing shoals misplacement and low details of the ENC compared to the Satellite Derived Bathymetry-ENC.
Figure 3, Baseline data on seafloor information based on satellite images and physics based algorithms.
Figure 4, Example of the seamless multisource bathymetric grid for the Persian Gulf, including Satellite Derived bathymetric data (left) and the GEBCO dataset (right).
The original version of this article was published in the January/February 2017 issue of Hydro International.]
http://GIM-INTERNATIONAL.comLunes 10 de Julio del 2017
GPS accuracy not ‘nearly perfect’
- Details
- Category: Ingeniería mundial
- Hits: 865

Photo credit: foter.com
When someone utters the words “I’m nearly perfect,” get on your toes. Such self-appraisal usually masks something. It could be insecurity, denial, ignorance or simply fear. At the very least, some level of illusion, if not delusion, is involved.
With that precept in mind, let’s examine a June 16 press release from the U.S. Air Force, under the headline “New reports confirm near-perfect performance record for civil GPS service.”
The press release actually says, “The U.S. Air Force released two technical reports demonstrating that the Global Positioning System (GPS) continues to deliver exceptional performance to civilian users around the world….The 2014 and 2015 performance reports confirm that the GPS Standard Positioning Service (SPS) satisfied nearly all measurable performance commitments documented in the GPS SPS Performance Standard.”
Fair enough. Those are demonstrable facts. Nowhere does the release — other than in its headline — employ the words “perfect” or “near-perfect.”
The problem is, as current events repeatedly show, people remember only the headline. That may be all that they read or register in the first place.
Affixing the label “near-perfect” to GPS is “potentially dangerous,” points out Dana Goward of the Resilient PNT Foundation, “because it could exacerbate the public’s growing over-reliance on, and often blind faith in, GPS. Even if GPS did always perform perfectly, all kinds of things can happen to signals after they leave the satellites and before they get to receivers. Personal privacy devices, other jammers, spoofers, solar activity, other electromagnetic interference, even the local geography can significantly degrade or disable a receiver’s performance. That’s why in the GPS System Performance Standard the Air Force specifically says its responsibility ends once signals are in space.”
Perfection might exist in space, but it doesn’t down here.
Even in space, accidents sure will happen. The Air Force release documents GPS performance for 2014 and 2015. This conveniently draws up short of January 2016, when several GPS satellites broadcast a timing error that triggered equipment faults and failures globally for nearly 12 hours. Thus demonstrating something far from perfection.
Issuing a statement in the manner done on June 16 perpetuates a dangerous myth, keeps users in the dark about the actual state of affairs, cultivates a What-Me-Worry? approach to positioning, navigation and timing, and abets the lack of political will and understanding of GNSS vulnerabilities.
We have expanded the focus of this magazine to cover other technologies relevant and applicable to the field precisely because GPS, and by extension GNSS, great though they may be, are not perfect. Not even nearly.
http://ABC.esLunes 10 de Julio del 2017
More Articles...
Conoce más sobre mi


Denuncias Públicas

Consultor Internacional

Sociedad Colombiana de Topógrafos

Ingeniería Mundial y Geomática

Cosas que no entiendo

Invitaciones

Mis Acciones en la SCI

Recomendados del mes

