La NASA muestra la primera imagen real de la estrella que alberga las '7 Tierras'

- Details
- Category: Ingeniería mundial
- Hits: 571
 Parece un mosaico con cuadrados blancos, negros y grises, pero esta imagen, procedente del espacio profundo, muestra la luz emitida por un astro situado a 40 años luz: TRAPPIST-1, la estrella enana roja en torno a la cual orbitan siete planetas con algunas características parecidas al nuestro. Los famosos exoplanetas cuya existencia anunció la NASA el pasado 22 de febrero y de cuyo hallazgo hasta ahora sólo habíamos visto recreaciones artísticas.
Ha sido captada por el telescopio espacial Kepler y es la primera imagen real que vemos del sistema solar de TRAPPIST-1, situado a 40 años luz de nosotros, desde que se anunció el descubrimiento de exoplanetas que alberga.
Los científicos no detectaron estos siete exoplanetas de forma directa, sino a través de los pequeños eclipses que causan cuando pasan delante de la estrella. Es decir, durante su órbita, cuando un planeta pasa delante de su astro, disminuye el brillo de éste, momento que es detectado por los telescopios que apuntan a ese astro. Esta técnica se denomina de tránsito.
Según ha explicado la NASA en un comunicado, la animación que han ofrecido esta semana muestra la cantidad de luz detectada por cada píxel en una pequeña sección de la cámara que lleva el telescopio Kepler. La luz procedente de la estrella TRAPPIST-1 es la que aparece en el centro de la imagen.
Un mosaico compuesto por 60 fotos
Entre el 15 de diciembre de 2016 y el pasado 4 de marzo, Kepler observó la estrella TRAPPIST-1 durante 74 días. Esta animación, en concreto, recoge 60 fotografías tomadas por la cámara el 22 de febrero. Durante una hora, tomó 60 imágenes, una por minuto.
De momento, en el archivo de exoplanetas o mundos fuera del Sistema Solar hay más de 3.450 objetos y su descubrimiento avanza a buen ritmo. Los hay con tamaños y características muy diversas, y el objetivo principal es llegar a encontrar un planeta que pueda ser considerado gemelo de la Tierra.
TRAPPIST-1 es una estrella ultrafría y es mucho más pequeña que nuestro sol. Este tipo de astros son los más comunes, pues representan aproximadamente el 75% de la estrellas que hay en nuestra galaxia.
Los científicos creen que los siete exoplanetas del sistema de TRAPPIST-1 podrían albergar agua líquida y tener temperaturas moderadas debido a la distancia a la que se encuentran de su estrella. Sin embargo, a los astrofísicos les gustaría encontrar un mundo que, además de que pueda tener agua líquida, orbite a un astro como el Sol pues creen que las superficies de los siete exoplanetas de TRAPPIST-1 podrían estar sometidos también a altísima radiación.
Lunes 13 de Marzo del 2017
3D GIS in China
- Details
- Category: Ingeniería mundial
- Hits: 3057
Chongqing Survey Institute Realised What Many Still Dream Of

Since 1998, the Chongqing Survey Institute (CSI) has been managing the 3D geoinformation database, including terrain, buildings, underground pipelines, geology and underground buildings, of the megapolis of 30 million people. For the commercial market, CSI’s 3D Mobile group focuses on combining the indoor and outdoor environment with e-commerce systems. Meanwhile, its BIM and GIS Integration group concentrates on three fields: geological survey, construction sector and municipal administration.
(By Frédérique Coumans, contributing editor, GIM International)
Chongqing is a city of unique topographical and landscape features. It is built on mountains and partially surrounded by the Yangtze and Jialing rivers, making mapping the city a big challenge for the Chongqing Survey Institute (CSI). Capturing the terrain in three dimensions is, due to the topographic features, an immediate plus. By integrating ground and underground 3D geoinformation, the 3D database of Chongqing is widely used in the fields of urban planning, utility management, construction simulation, emergency response, etc. CSI has been honoured as an advanced city survey unit in China several times. There are tens of millions of objects in the database, which currently covers spatial objects of 82,000km2, including both above-ground and underground structures, roads, terrain and (underground) pipe networks. Chongqing is changing at an annual rate of approximately 5%, mainly because of the development of new urban areas. There are about 30 employees responsible for the maintenance of the 3D geodatabase. “For pipeline data this is automated with rule-based workflows, but other 3D data still requires manual modelling,” explains Ms Mei Xue, vice chief engineer of CSI and also in charge of the Geo-Information department. “According to the local regulations, when a building or a civil project is completed, the 3D model needs to be input into the database. So far we’ve been updating the database on a monthly basis.”
Not only for visualisation
The Chongqing 3D models are highly informative models; one can take coordinates from the 3D objects, other attributes and hyperlinks for further information, etc. Therefore the 3D models with different levels of detail – from topographic sources to civil & infrastructure engineering and AEC – are not only for visualisation purposes, but are also widely used in environmental simulation and decision-making. They facilitate many changes. For instance, the rule-based 3D engine provides real-time adjustment, 3D simulation and assessment for the planning and design schemes. These are new but very effective technological tools for the workflow planners, according to Ms Xue: “The 3D engine can also be applied in ‘intensive’ city management when connected with information about enterprises, population and real estate.”
CSI maintains a leading position at national level in the aspects of key 3D city simulation and 3D modelling technologies, mass multi-source data integration, and so on. A total of 66 software programs with independent copyright have been developed and 29 national patents were acquired which brought notable economic profit and social benefit. “With the rapid development of 3D geodata acquisition techniques, the biggest challenge is no longer the timely generation of urban data. Rather, it is in relation to how so much information can be exploited and integrated successfully into contemporary spatial planning and management. And we have to solve the redundancy and inconsistency issues when modelling data from different sources,” Mei Xue adds.
The promising 3D technology makes ever-more demands on the capabilities of the institute’s staff. They are focused on the cultivation of cross-functional skills and teams in software engineering, surveying and mapping, geology and law. Furthermore, there is a growing need for engineers who are keen to become experts in big data modelling and data mining. The role of a surveyor is changing, of course. “With the modernisation of surveying and mapping technology and equipment, many surveyors now need to work indoors as well – some of them are in charge of research & development tasks.” There are 914 surveyors at the institute, 587 of whom work outdoors.
User benefits
Elsewhere, most 3D tools have to be used with 2D GIS and then visualised in a 3D environment (draping attributes over surfaces, so in effect 2.5D). That is not the case in Chongqing. The special topography of Chongqing makes it very difficult to demonstrate the complex topographic and landscape characteristics through 2.5D maps. Therefore, Ms Xue and her team use the concept of micro-topography to conduct 3D modelling based on the comprehensive utilisation of procedure modelling, building information modelling (BIM), Max modelling and oblique imagery modelling. “We’ve also developed our own software platform for the integration, management, dissemination and application of data. This platform supports the 3D analysis on matters such as landforms and sunlight. However, professional analysis software is still needed in terms of the complex environmental simulation analysis – noise, atmosphere, dewatering, etc.”
The establishment of the 3D database requires vast investment in data collection, update and maintenance management. However, the vice chief engineer does not give any numbers, not even on the plus side (describing them only as “very remarkable benefits”). When asked about the applications of 3D GIS which deliver the greatest user benefits in Chongqing, she answers: “I’d say the 3D civil design application and the 3D urban planning review application. These two applications are widely used by both the public and private sector in Chongqing. In the planning and design field alone, the 3D database has created enormous economic benefits. For example, thanks to our high-performance and very up-to-date database, we can provide new kinds of 3D survey and design services with greatly improved competitiveness on the commercial market.”
E-commerce
For the commercial market, the institute’s 3D Mobile group focuses on combining the indoor and outdoor environment with e-commerce systems. Citizens can view the restaurants and shops, search the racks of clothes in real time, view the price tags and use their mobile devices to make purchases. The 3D environment of the shops is captured by the Chongqing Survey Institute, and the retailers themselves can update the information about their merchandise on the platform. The institute has set up an internet-based operation platform and – equally importantly – has established good cooperative relationships with the local commercial enterprises who also sell via e-services. That required new marketing expertise. The main technological challenge for CSI in combining the indoor and outdoor environment with e-commerce systems is the real-time image mosaic and fusion technique. Due to the frequently changing indoor environment – and in particular the displayed goods – the store owners need a convenient and efficient way to automatically match and correct the real-time images of their brick-and-mortar shops and update commodity information after the indoor photos are uploaded.
BIM
Nowadays integrating 3D data with different semantics, especially BIM and GIS, is one of the biggest challenges in the 3D domain. CSI’s BIM and GIS Integration group is addressing the integration issue in both the architecture and civil fields. The team has also developed software to integrate and simulate the BIM models of buildings, roads, bridges and parcels in the 3D GIS environment. According to CityGML’s level of detail (LOD) concept, most of the 3D models are at LOD2-3, while a small number of core areas reach LOD4 due to the integration with BIM data. The accuracy of data is consistent with the 1:500 topographic maps. Mei Xue: “In my opinion, what matters most in the integration with BIM data is the semantic divergence and difference rather than the accuracy of data. Interoperability is the keyword of GIS-BIM integration for which cross-functional knowledge, experience and communication are crucial.” At present, a team of 20 has been set up to conduct technical research into the integration of BIM and GIS, primarily comprising three fields: geological survey, construction and municipal administration. With the professional BIM technical engineers and software research & development employees in each sector, CSI has completed several pilot projects in all three fields. “The economic value of these pilots, however, is yet to be examined through market projects,” states Ms Xue, indicating one of her plans for 2017. Another plan is to provide spatial data for the construction of smart cities. “This year we hope that more BIM models can be integrated in the 3D database for the pilot applications of smart city. Another important goal is to provide BIM engineers with better GIS tools. In the field of civil design, the designed roads and pipelines need to be integrated into the geographical environment. But today’s BIM software is not very well suited to cope with the high volume of 3D geodata about the area in which the new constructions are planned. We will provide a cloud-based 3D platform to our BIM engineers. By uploading the proposals to the cloud, they can simulate the proposals in a 3D geospatial environment and assess the environmental impact.”
CSI
Established in 1950, the Chongqing Survey Institute (CSI) is one of the oldest urban surveying institutes in China. The institute is part of the Chongqing Municipal Planning Bureau. The amount of public funding each year depends on specific programmes. Most of them are basic survey programmes, e.g. to produce and update 1:5,000 DLG (digital line graphs), DEM (digital elevation models) and DOM (digital orthophoto models) data. By far the largest part of the institute’s income comes from commercial activities, such as geology surveys, GIS software development, civil programme design and engineering surveys. CSI employs over 1,000 multi-disciplinary staff, including six women in high management positions (out of 67). The average age of the employees is 35.
Chongqing is a mega-city – or sub-province – in southwest China and one of four municipalities directly controlled by the central government (as are Beijing and Shanghai). Chongqing is a rapidly urbanising area of more than 82,000km2 and it has a population of nearly 31 million people.
Jueves 09 de Marzo del 2017
Digital Transformation in New Zealand
- Details
- Category: Ingeniería mundial
- Hits: 795
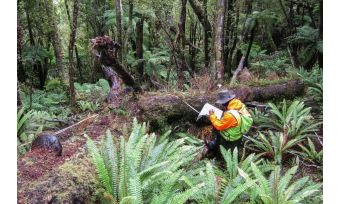
In January 2016, staff from New Zealand’s Department of Conservation (DOC) were supplied with tablets and smartphones equipped with Survey123 for ArcGIS, a form-centric mobile data collection application. The Hokitika township biodiversity monitoring field team used this mobile app as well as their current paper-based capture methods to evaluate the potential of digital data collection technologies in their workflows. This undertaking showed that not only can Survey123 improve efficiency and reduce field data capture operational costs, but it can also make captured data available easily and instantly for visualisation and analysis.
(By Ismael Chivite, Senior Product Manager, Esri)
Like many other government departments, the New Zealand DOC is going through a digital transformation, replacing paper-based workflows with end-to-end business processes in which information flows instantly across staff teams, departments and – when appropriate – the public. Modern enterprise geographic information system (GIS) technology allows everyone in an organisation to create, access and share information anywhere, anytime and from any device, making their work more efficient and meaningful.
At the New Zealand DOC, wildlife surveys are typically conducted using paper booklets. “The paper-based methodology that we use at the moment is functional, but it requires a massive downstream team to digitise that information. It’s sometimes even necessary to go back to the field team to confirm the data because it’s unreadable due to smudging or rain,” says Benno Kappers, DOC natural heritage information project leader. “Real-time mobile data collection can significantly reduce downstream efforts.”
Smartphones instead of paper
A pilot programme was initiated to expose the New Zealand DOC staff to using mobile devices for in-field data capture as well as to compare the end-to-end system and organisational processes of both the electronic and traditional paper-based collection methods. Field crews were provided with Android smartphones and tablets. The software on these devices was Esri’s Survey123 for ArcGIS, a data gathering mobile app that speeds up the collection process using simple forms. The programme’s team visited three remote locations on New Zealand’s South Island to survey possum crossings along fixed transects (paths).
Efficiency in the field
Using a simple spreadsheet and the mobile app’s desktop companion tool, Survey123 Connect for ArcGIS, customised forms were created and published in the ArcGIS platform. These forms were then downloaded to the mobile devices to facilitate the collection of information in the field.
Survey123 provided a simple, intuitive interface for users to input field data, which enabled staff to concentrate on making observations rather than on the process of recording them, which was one of the issues with paper-based data collection. Validation rules and expressions configured in the forms reduced the number of user-input errors.
Downstream gains
Capturing data via traditional paper-based methods involves not just recording field data but also scanning and uploading it to the server, as well as physical logistics such as inventorying and shipping completed booklets. Much of the work in these processes was greatly simplified – if not eliminated – with app-based data collection.
Collecting data through forms on smartphones provided New Zealand DOC with greater control of field-user input. “People became far more concise about what they needed to say,” explains Kappers. “That is helpful not only from an efficiency perspective but also from a data management one.” Through the use of forms, the data captured was better structured than with paper submissions, and error-prone digitisation processes were eliminated as well.
Real-time access to information
Getting feedback on paper-recorded data can take several months. After inputting information into Survey123, captured data was directly transferred back to the ArcGIS platform, where other members of the organisation could access the data in tables, maps and other types of information products. This real-time integration of field-collected data into an enterprise GIS platform made the storage, quality assurance, analysis and viewing of information more efficient and less costly.
Results
Not only did the new software make the processes that staff undertook more efficient and less costly, it even rendered some processes unnecessary. Many tasks – including printing field booklets for every recorded plot, scanning the pages and uploading the scans to the server; packing, sending and tracking field booklets to the server in Christchurch; and issuing, digitising and performing quality assurance on booklets – have all been made obsolete due to the capabilities of Survey123 for ArcGIS. Additionally, in the pilot programme, these capabilities showed a reduction of 336 staff hours per monitoring method, per season.
Sharing with citizens and stakeholders
For the New Zealand DOC, digital data collection with smartphones has been proven to make processes more efficient, in particular in downstream procedures but also in preparation work. In addition, departments can now provide almost-instant feedback on the data that staff supply, and once this data is integrated into online maps it can be shared with numerous citizen groups and stakeholders in the community with an interest in wildlife conservation, natural resource protection and stewardship of the planet. “These measurements that we undertake follow strict national protocols and could all be followed by community groups as well,” comments Kappers. “If Survey123 allows us to share these forms with private community groups, the same information management which enables us to start comparing measurements of New Zealand’s public land can also be applied to private land parcels. And that is a really valuable contribution to make.”
Further improvements
New features and fixes are added to Survey123 for ArcGIS through monthly upgrades to the product. High-priority items in the road map include adding the ability for field users to capture areas and linear features as well as location data. Additionally, improvements are being made to workflow editing capabilities, including the ability to update existing database records. These two new features will become available in the first half of 2017 across all supported platforms.
About the author
Ismael Chivite works as a senior product manager at Esri. With over 20 years of GIS experience, Chivite is passionate about building ArcGIS products that help organisations use geography to improve the way they work.
Jueves 09 de Marzo del 2017
Geomatics and Surveying in Support of Land Administration
- Details
- Category: Ingeniería mundial
- Hits: 742
Implementing Tenure Security for All

Today’s geospatial technology means that land administration systems can increasingly be implemented for the benefit of all. It is now possible to conceive approaches to capturing the unrecorded geometry of boundaries for the billions of unrecognised land interests or spatial units. In addition, new approaches are becoming apparent for the maintenance of collected data. Examples from the field show that we’re well on the way to responding to the challenge. From a geomatics and geoscience perspective, many tools are already available to support development, but further steps are needed to operationalise them at scale. Read on for an article investigating a few of the emerging options.
(By Christiaan Lemmen, Rohan Bennett and Paul Saers, The Netherlands)
Land information tells us about the ownership, use, value and development of land – whether statutory, informal or customary. It provides an overview of people-to-land relationships. It shows us how people relate to the space around them. The information can be used to realise responses to major societal challenges, e.g. the UN 2030 Agenda for Sustainable Development. Geoinformation and Earth observation provide the inputs. These include satellite and drone imaging and mapping, global navigation satellite system (GNSS) positioning, cartography, spatial data infrastructures and many surveying sub-disciplines. This article takes a look at how each of these tools is helping to operationalise land administration at scale – and also what challenges need to be overcome to realise the potential.
Using Imagery
In the last few years, there has been considerable buzz surrounding ‘fit-for-purpose land administration’. The approach argues for cost-effective, time-efficient, transparent, scalable and participatory systems. The philosophy is driven by the idea that, in many situations, it is sufficient to identify visual boundaries based on imagery. This means making use of photographs, images or topographic maps in the boundary adjudication and mapping activities. Alternatively, apps on mobile devices can be combined with imagery to identify plots, thus avoiding misinterpretation of visual boundaries on the image. Images can be collected from satellites, traditional aircraft or unmanned aerial vehicles (UAVs). In cases of high land values or intensive land use, the field surveys can be conventional land surveys using high-precision total stations or GNSS.
Standardising Models
Alongside the push for the increased use of imagery, global standards such as the Land Administration Domain Model (LADM) focus on standardised modelling of information at the conceptual level. The model does not include processes for initial data acquisition, data maintenance and data publication. This is because those processes were considered to be country-specific when the first edition of LADM was prepared; a generic and global approach was likely to be difficult to model. This view now needs reconsideration, however. The fit-for-purpose land administration approach arguably allows for identification of more generic process-related modules in data acquisition and data handling. Standardisation can also make it easier to monitor the progress of global indicators relating to land tenure security.
Focusing on Processes
So what are some of these processes that might be supported? Examples include initial data acquisition, georeferencing (based on elevation models), identification of boundaries, surveying (based on imagery, conventional surveys, UAVs, digital pens for imagery and handwriting, feature extraction/data cleaning, radar), area management, linking rights, restrictions and responsibilities (RRRs) to spatial units, linking (groups of) persons to (shares in) RRRs, public inspection, publication of land data, formalisation, map renovation and quality improvement and digital archiving. Computerising large sets of legacy data (maps and archives) requires analogue-to-digital conversion, georeferencing and linking to digital data from other sources. Data may be used for taxation, tenure security purposes, slum upgrading, city management and so on. This also includes land use and zoning plans implemented by land consolidation and land readjustment processes. Statistical information such as fragmentation index and price index may need to be derived from the land administration. Imagery may be available on paper or on mobile devices in the field, or both.
Creating a Tenure Atlas
Another challenge in many countries is that several authorities may play a role in the process of recognising, recording, registering and managing the land tenure, and they may each maintain their own land information sets. Therefore, at national level, coordination is needed; a Land Tenure Atlas could be developed to provide an overview of the spatial distribution of legitimate tenure types throughout a country – be they customary, informal, private, public or otherwise. The Atlas may further include a layer for national and administrative boundaries and potentially a layer for planned and ongoing projects in land administration. The Atlas should be able to be aggregated to global level, enabling linkage to proposals for international data exchange representing the different RRRs in use within countries.
Utilising Devices
Surveyors and geoprofessionals focus on geometric accuracy, and this focus should result in quality labels identifying the relative and absolute accuracy of geometric data. This is relevant for later adjustment and integration of data from different sources collected with different instruments and tools in different approaches. But land administration is not only about geometric data. Talking about quality in land administration means not only talking about geometric accuracy, but also about ‘linking’ between polygons (spatial units) and people (right-holders). It would be nice if functionalities could be combined in one single device, i.e. linking functionalities for image-based data acquisition to handheld GPS, biometric data (fingerprint identification and facial recognition) and voice/video recording in support of object identification. Such devices would also be useful for inspections, for fieldwork related to building and construction permits, for cadastral maintenance, etc. Land data collected on many devices could deliver results in formats based on operational standards.
Integrating with OGC
The Open Geospatial Consortium (OGC) recognises that worldwide, effective and efficient land administration is an ongoing concern, inhibiting economic growth and property tenure. Existing approaches are at significant risk of data loss and failure due to disasters and lack of interoperability. The charter members of an established OGC Land Administration Domain Working Group are seeking to identify enabling standards and best practices to guide countries in a programmatic way towards establishing more cost-effective, efficient and interoperable land administration capabilities. Attention will be paid to upgrading currently manual processes to semi-automated ones, and to suggesting new approaches for data acquisition that are more automated and flexible. These challenges are faced today in ‘developing’ and ‘developed’ countries alike.
Developing Cooperation
Enabling standards are also being developed with other domain working groups within OGC, such as LandInfra. Partnerships and liaisons with other associations and standards developing organisations (SDOs) will be developed to address interoperability issues that span the land administration community of practice, geographic information systems and the broader IT environment. Examples include linkages with ISO TC 211 regarding the LADM as well as those SDOs responsible for IT standards related to topics such as security, the internet and mobile services. Further, the DWG will be open to participation by any interested organisations and individuals.
Industrialising Approaches
The geospatial industry provides tools, products and services in support of a number of important processes required in fit-for-purpose land administration. Image-based acquisition of cadastral boundaries needs access to huge image libraries – including historic imagery – to support large-scale implementations. Detection and selection of cloud-free imagery is needed to create cloud-free compositions, possibly from different sensors. By using orthophotos to produce spatial frameworks, the imagery is typically linked to the national geodetic reference frame through GNSS in space/on the aircraft and on the ground. Furthermore, automated feature extraction and feature classification appear to be very promising developments for the generation of coordinates of visual objects from imagery, and Lidar and radar technologies can also be used for this purpose. ‘Pre-defined’ boundaries resulting from feature extraction may be plotted on paper or visualised in interfaces, and can then be declared identical to cadastral boundaries in the field.
Modernising Demarcation
In general, fixing boundaries should be avoided in the preliminary stages. It has been shown that demarcation with monuments or beacons often takes 80 to 90% of the surveyor’s time. If demarcation is an absolute requirement, let people place the beacons themselves. Otherwise, it is a good idea to explore modern demarcation methods – smart markers could provide a good alternative. Modern markers like the traceable 3D radio frequency identification (RFID) markers can be detected and identified from a distance of several metres using a simple smartphone. The RFID in the marker can store administrative and positional data. It eliminates all known drawbacks of traditional markers. They could be used as main markers or georeferenced markers, supplemented by locally surveyed points demarcated with low-cost materials. RFID boundary marker strips cost less than EUR1 to produce – although that does not necessarily make it affordable in some countries, of course.
Utilising UAVs
UAV or ‘drone’ technology is rapidly developing, although autogyro platforms may represent another possible solution for aerial image capturing. Such platforms can operate at low to medium heights, thus largely eliminating the risk of images being obscured by cloud. In some cases, walking can be an alternative to low-altitude flying, e.g. using a portable 3D laser scanning device, the surveyor can map a strip extending 200 metres to each side of the trajectory on foot.
Handling the logistics
Processes such as initial data acquisition may concern millions of spatial units (parcels) for which people-to-land relationships have to be determined. The organisation of this process requires geospatial support in logistics and case/task management based on geoinformation. This starts with gaining an overview of the density of information. This is about estimating the amount of spatial units in a project area for planning purposes. Provision of materials and tools to data collectors can involve paper-based or digital approaches. A paper-based approach entails using plotted images in the field. This means that the collected field-boundary evidence can be left with the local people, providing a scan is available for the land administration authority. However, even paper-based approaches require a comprehensive range of geospatial technologies. Logistics activities include the processes of creating awareness of and announcing participatory approaches, agreeing on citizens’ roles in the land administration process, and publishing status information online/offline, as well as performing checks on completeness before leaving a location. Collecting copies of people’s ID, photos, signatures, fingerprints and video/voice recording requires field devices and battery power/electricity.
Handling maintenance
Data maintenance can be ‘programme driven’ (systematic) or ‘sporadic’. ‘Programme driven’ means a complete and systematic new acquisition after some time. ‘Sporadic’ means case by case in a ‘transaction-driven’ way and relates to transactions in the land market (buying/selling, mortgaging, etc.). Quality upgrading can be part of the maintenance process. This may be required after digitisation of legacy data or in the case of urbanisation or urban planning. It is crucial that data collected using survey approaches based on different accuracies can be integrated together. This may require adjustment of new observations to existing coordinates in the field or within GIS. Quality upgrading may also entail integration of 3D cadastral data (this includes integration with standards such as IndoorGML, InfraGML, LandXML, CityGML, BIM/IFC) and marine cadastre.
Concluding remarks
Implementation of all the processes presented here is currently undertaken in different places based on customisation from available databases and GIS technology. This is a time-consuming activity which demands GIS and ICT development expertise. Standardisation is required for those processes and needed in order to bring scalable approaches – ones which can be easily implemented based on the defined purposes of each land administration project.
Further reading
- Enemark, Stig, McLaren, Robin, Lemmen, Christiaan, 2015: Fit-For-Purpose Land Administration – Guiding Principles. UN-HABITAT/GLTN, Nairobi, Kenya
- GIM International, 2016. Special Issue on Fit-For-Purpose Land Administration for Sustainable Development. Geomares Publishing, Lemmer, The Netherlands
- OGC, 2016, Domain Working Group (DWG) Charter Land Administration. Open Geospatial Consortium. http://www.opengeospatial.org/projects/groups/landadmin
Biographies of the authors
Christiaan Lemmen
Christiaan Lemmen holds a PhD from Delft University, The Netherlands. He is a geodetic advisor at Kadaster International and visiting researcher at University of Twente/ITC, The Netherlands. He is director of the FIG Bureau OICRF. He is co-editor of ISO 19152 LADM.
Rohan Bennett
Rohan Bennett gained his doctorate from the University of Melbourne, Australia. He is an associate professor working in land administration at the University of Twente/ITC, The Netherlands, where he is also director of the School for Land Administration Studies at ITC.
Paul Saers
Paul Saers has an MSc in geodesy and geoinformatics. He is a geodetic advisor at Kadaster International in The Netherlands. He is specialised in the management of computerised land administration systems, BPR, ERP and QMS.
Jueves 09 de Marzo del 2017
La NASA propone un campo magnético para que Marte recupere sus mares
- Details
- Category: Ingeniería mundial
- Hits: 716
Científicos de la NASA han propuesto, nada menos, que el despliegue de un escudo magnético que podría mejorar la atmósfera de Marte y facilitar las misiones tripuladas allí en el futuro.
Durante el Planetary Science Vision 2050 Workshop, organizado esta semana por la División de Ciencia Planetaria de la NASA, su director, Jim Green explicó esta ambiciosa idea durante una charla sobre El futuro medio ambiente marciano para la ciencia y la exploración.
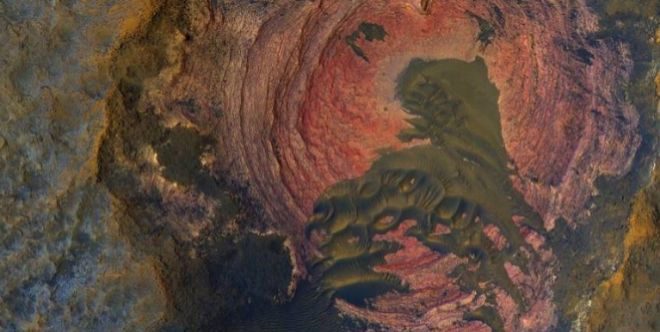
El consenso científico actual es que, como la Tierra, Marte alguna vez tuvo un campo magnético que protegía su atmósfera. Hace aproximadamente 4,2 mil millones de años, el campo magnético de este planeta desapareció repentinamente, lo que causó que la atmósfera de Marte se perdiera lentamente en el espacio. En 500 millones de años, Marte pasó de ser un ambiente más cálido y húmedo al frío e inhabitable lugar que hoy conocemos.
Para superar el problema que esto representa para la colonización de Marte, Green y un panel de investigadores sugieren que mediante la colocación de un escudo de dipolo magnético en el punto Mars L1 Lagrange, se podría formar una magnetosfera artificial que abarcaría todo el planeta, protegiéndolo así del viento solar y la radiación.
En su exposición, reconocieron que la idea podría sonar un poco "fantástica". Sin embargo, enfatizaron cómo la nueva investigación en magnetosferas en miniatura, para la protección de tripulaciones y naves espaciales, apoya este concepto: "esta nueva investigación se está produciendo debido a la aplicación de los códigos completos de física de plasma y experimentos de laboratorio.
En el futuro es muy posible que una o varias estructuras inflables puedan generar un campo de dipolo magnético a un nivel tal vez de 1 ó 2 Tesla (o 10.000 a 20.000 Gauss) como escudo activo contra el viento solar", ha explicado Green según informa Universe Today.
Además, el posicionamiento de este escudo magnético aseguraría que las dos regiones donde se pierda la mayor parte de la atmósfera de Marte estarían protegidas. En el transcurso de la presentación, Green y el panel indicaron que los principales canales de escape están localizados "sobre la capa polar norte con material ionosférico de mayor energía, y en la zona ecuatorial con un componente estacional de baja energía con un escape de iones de oxígeno de 0,1 kilos por segundo".
Para probar esta idea, el equipo de investigación -que incluyó a científicos del centro de investigación de Ames, del centro del vuelo espacial de Goddard, de la universidad de Colorado, de la universidad de Princeton, y del laboratorio de Rutherford Appleton- condujo una serie de simulaciones usando su magnetosfera artificial propuesta, para ver cuál sería el efecto neto.
Lo que encontraron fue que un campo dipolar situado en el Punto de Lagrange L1 de Marte sería capaz de contrarrestar el viento solar, de modo que la atmósfera de Marte lograría un nuevo equilibrio. En la actualidad, la pérdida atmosférica en Marte es equilibrada en cierto grado por el saliente volcánico desde el interior y la corteza de Marte. Esto contribuye a una atmósfera superficial que es de aproximadamente 6 milibares en la presión del aire (menos del 1% que a nivel del mar en la Tierra).
Como resultado, la atmósfera de Marte naturalmente se espesaría con el tiempo, lo que conduciría a muchas nuevas posibilidades para la exploración y colonización humanas. Según Green y sus colegas, estos dipolos incluirían un aumento promedio de alrededor de cuatro grados centígrados, lo que sería suficiente para derretir el hielo de dióxido de carbono en la capa de hielo polar del norte. Esto provocaría un efecto invernadero, calentando aún más la atmósfera y haciendo que el hielo de agua en las capas polares se derrita.
Según sus cálculos, Green y sus colegas estimaron que esto podría llevar a que se restablezca una séptima parte de los océanos que cubrieron Marte hace miles de millones de años, un sistema que culmina en la terraformación.
Martes 15 de Marzo del 2017
More Articles...
Conoce más sobre mi


Denuncias Públicas

Consultor Internacional

Sociedad Colombiana de Topógrafos

Ingeniería Mundial y Geomática

Cosas que no entiendo

Invitaciones

Mis Acciones en la SCI

Recomendados del mes

